For SimpleSummit, we needed a program to demonstrate multi-node computing, show the impressive power that GPUs possess, and create a visually interesting and interactive user experience.
What are fractals?
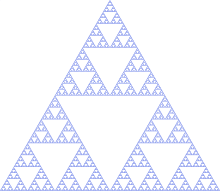
A fractal, roughly, is any pattern that has self similarity, see, for example, the Sierpinski Triangle, which looks like this:
More interesting and complex are fractals based on escaping sets. The most famous of these is the Mandelbrot Set.
To understand how this computations work, you need to know what a complex number is. Essentially, every point on the screen is mapped to a complex number, based on the horizontal on vertical position. We call this number , and first set . Then, we continue running until escapes a certain radius (which is most of the time). We record the number of times we computed , and apply a color based on that. Here is a image rendered using a maximum of 12 iterations:
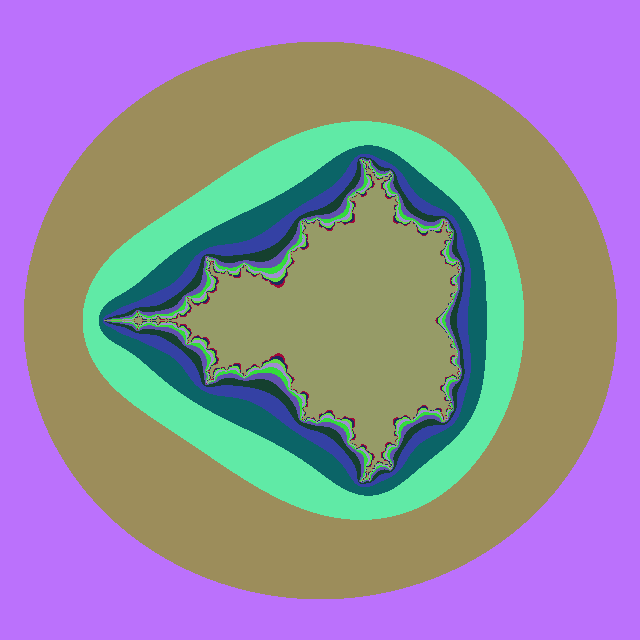
You will notice bands of color that start as a circle outline, and slowly approximate a complex shape. The complex shape it approaches is precisely the set of numbers that never get larger than our radius, , no matter how many times is ran. Each time the color band changes, that means the points inside that band take one more iteration than the next outermost layer. So, points in the outer purple color may take iterations of before , points in the brown color take iterations, points in light green take iterations, and so on, until the innermost shape that is brown again. For these points, the absolute value of does not get larger than within the maximum iterations (which is ) of evaluating . If we re-run with a larger number of iterations, say , the innermost group of pixels will get slightly smaller, but will still approach the Mandelbrot set exactly.
Calculating and rendering fractals, a very difficult computational problem, is well suited for GPUs and distributed workloads. Each pixel on the screen can be computed independently of all others, so the GPU can launch a kernel to compute all pixels at once, instead of waiting on pixels to finish. And, each node of the SimpleSummit system can compute just a part of the screen, so that the workload is further parallelized.
Fractals that we use
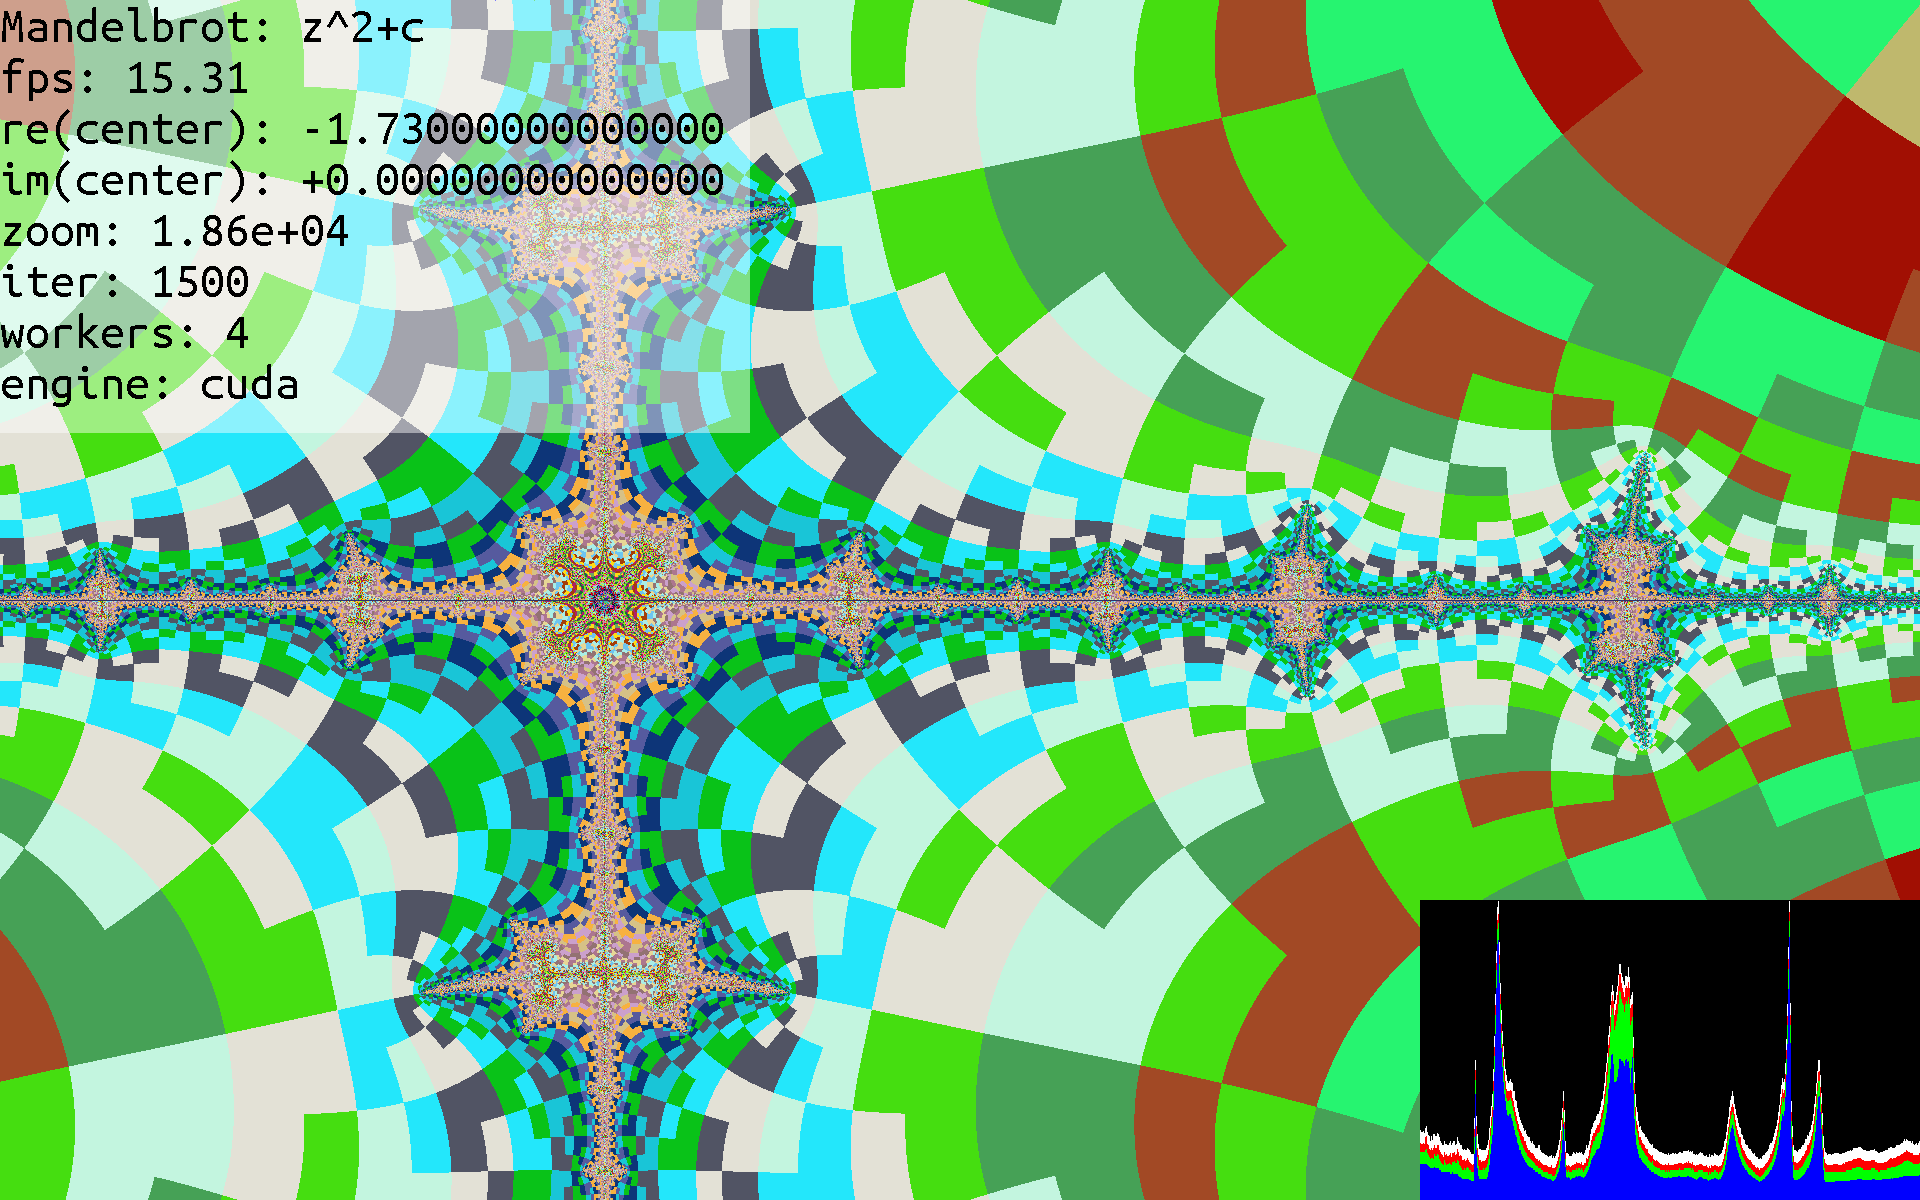
We show a few different kinds of fractals. With fractalexplorer, you can see the name and equation of the fractal at the top left of the screen.
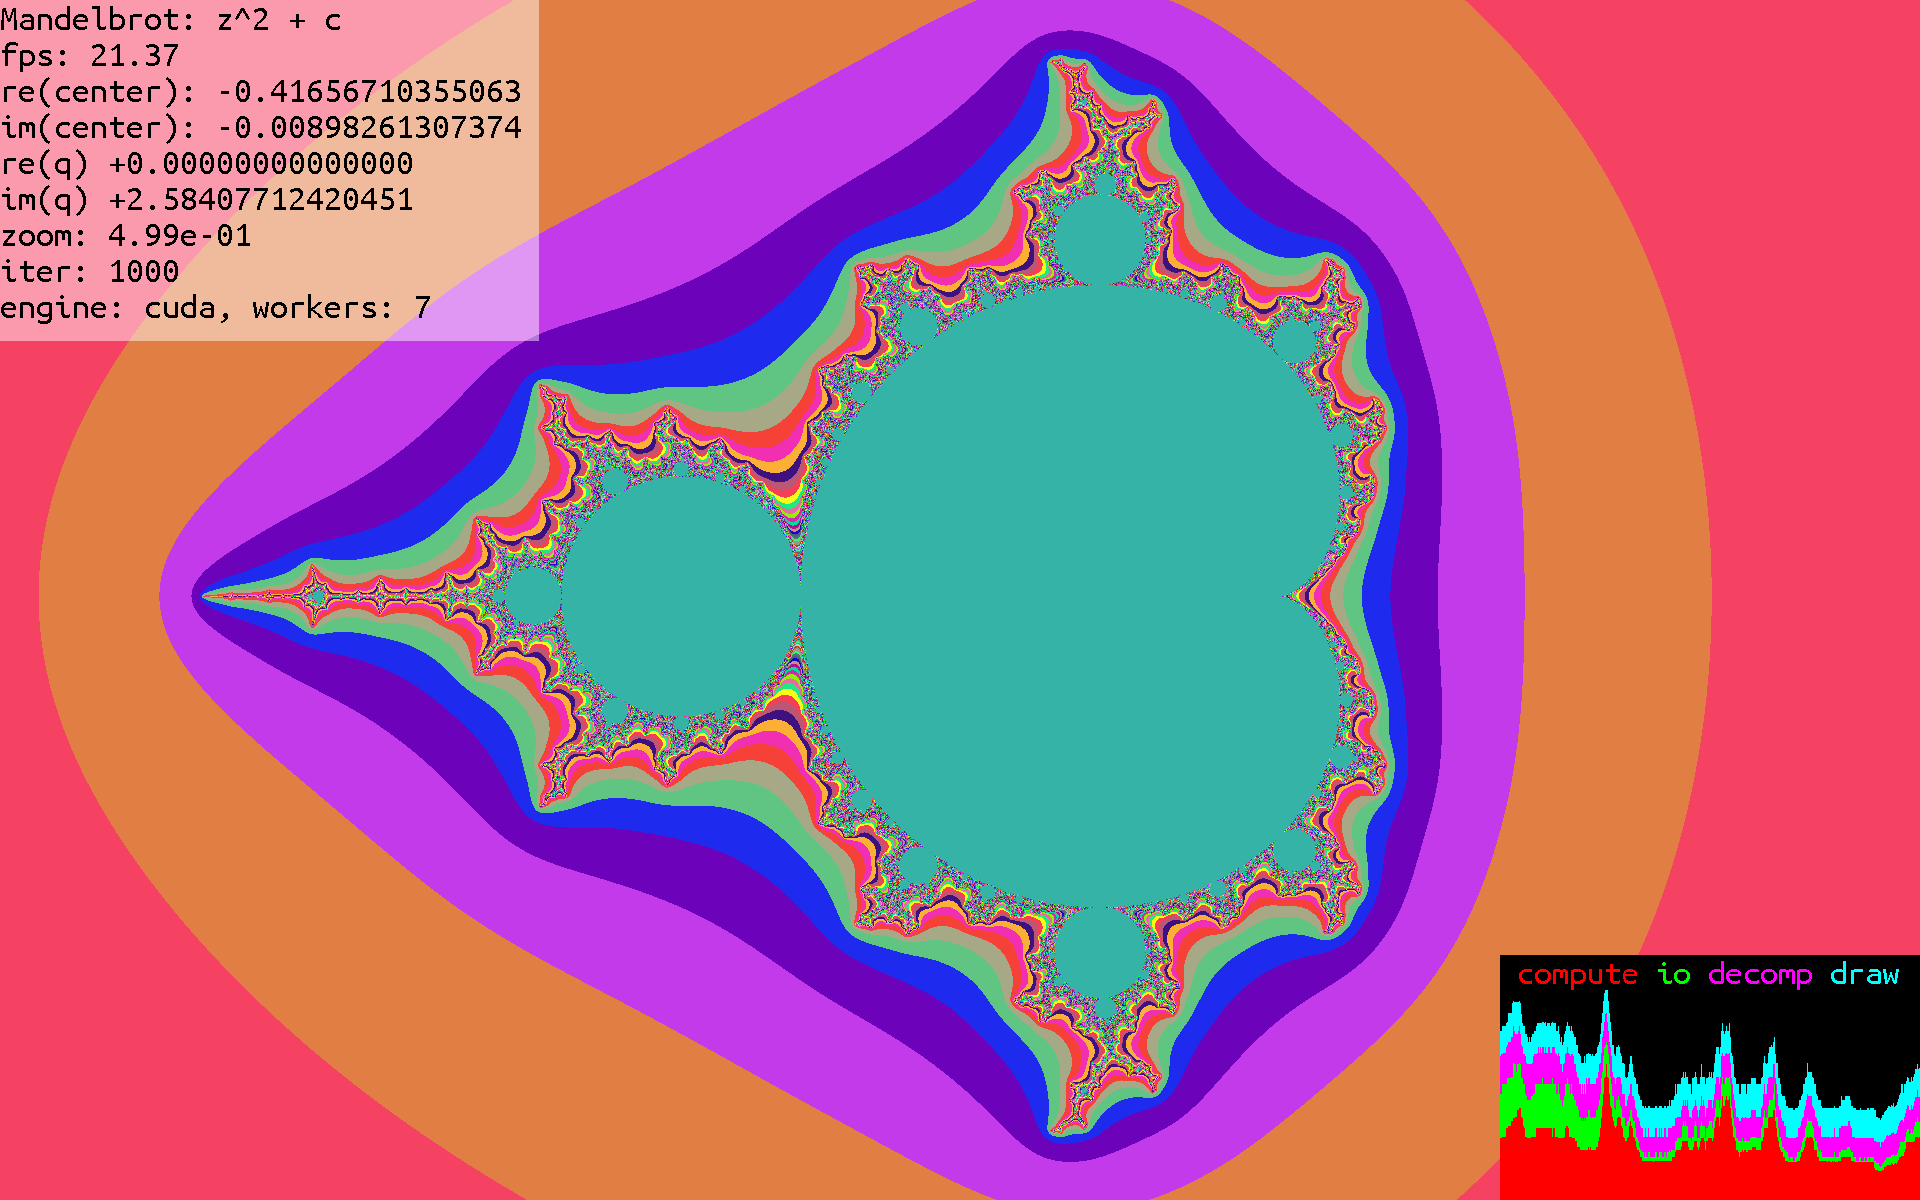
Mandelbrot
The most common, is the Mandelbrot. Generated using the equation . Here is what that looks like:
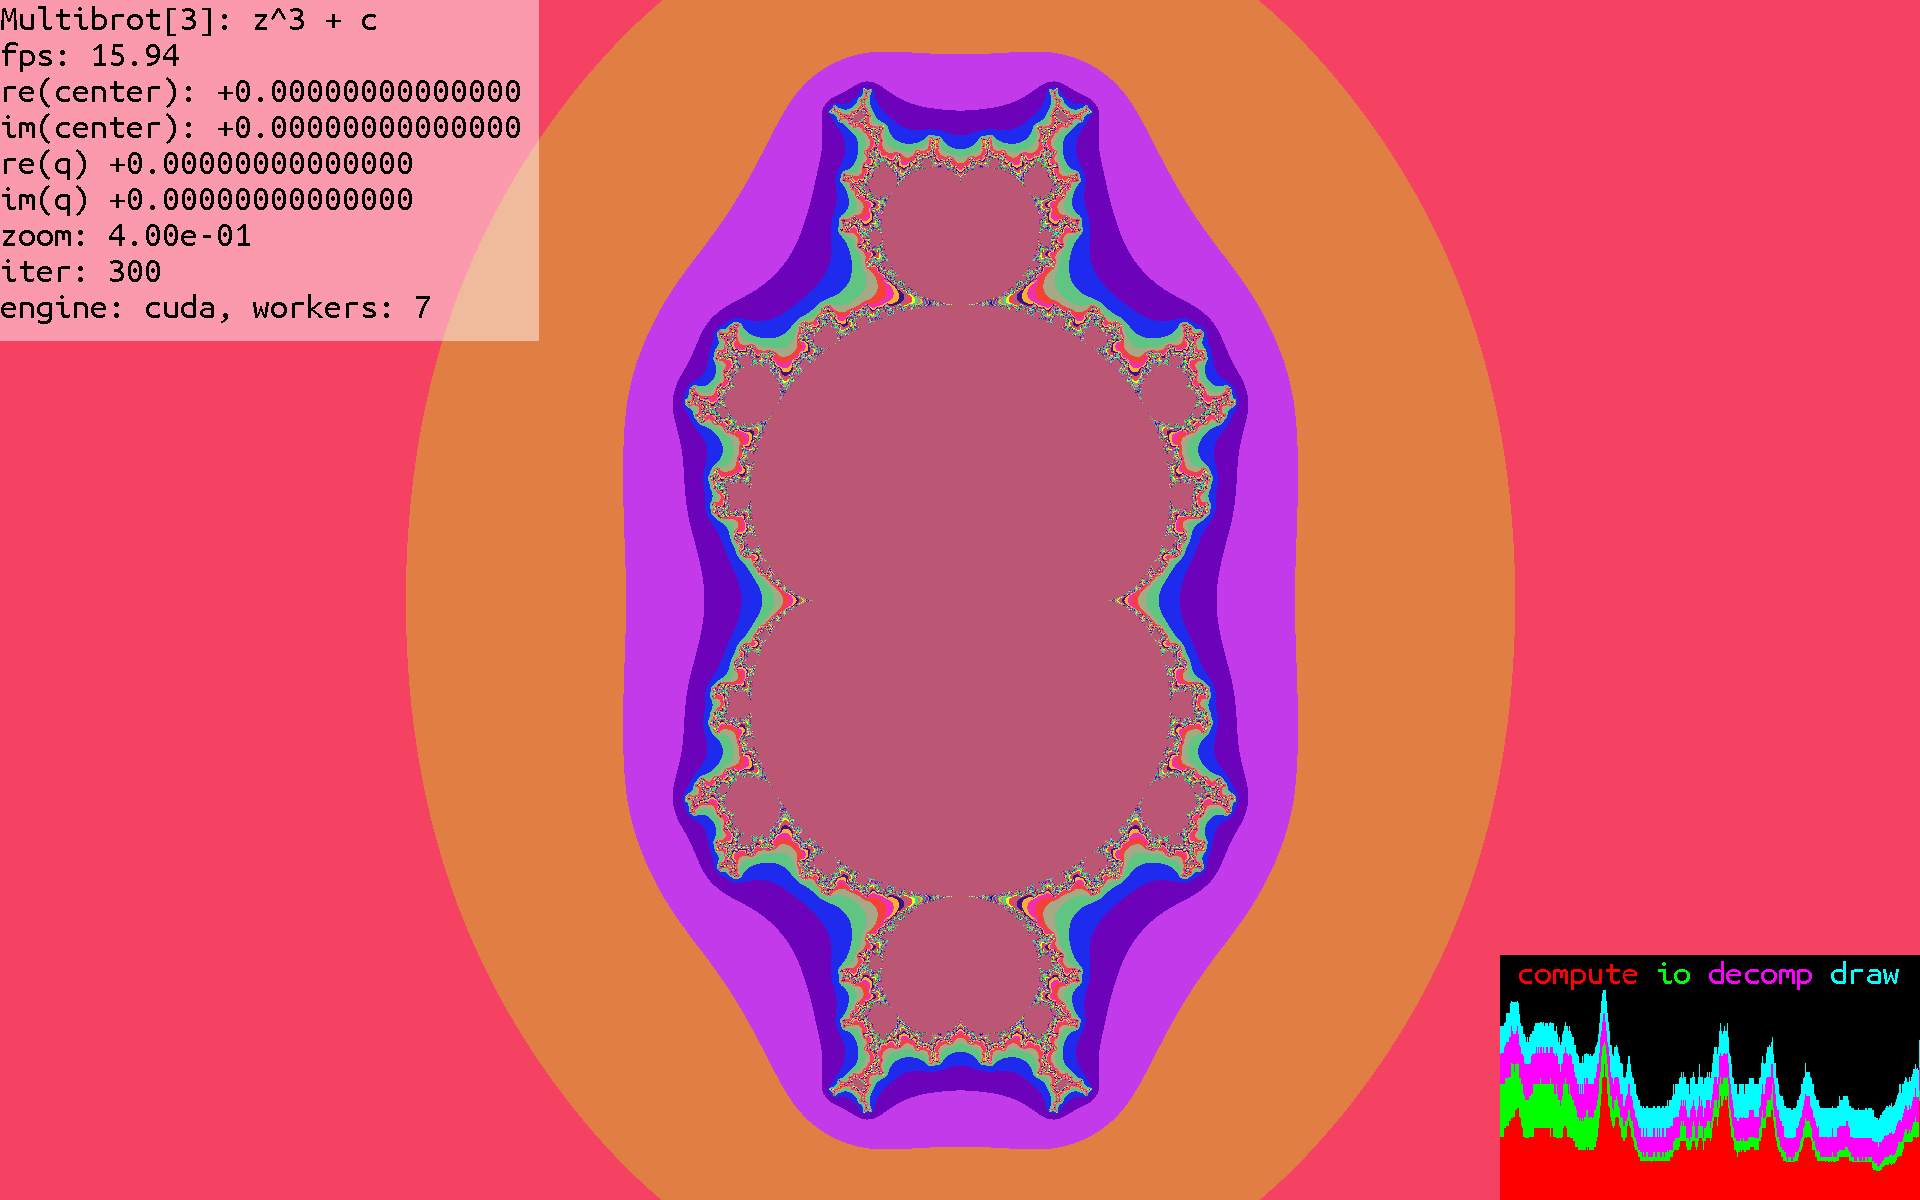
Multibrot[3]
A slight variation on the Mandelbrot set, using an exponent of 3. Generated using the equation . Here is what that looks like:
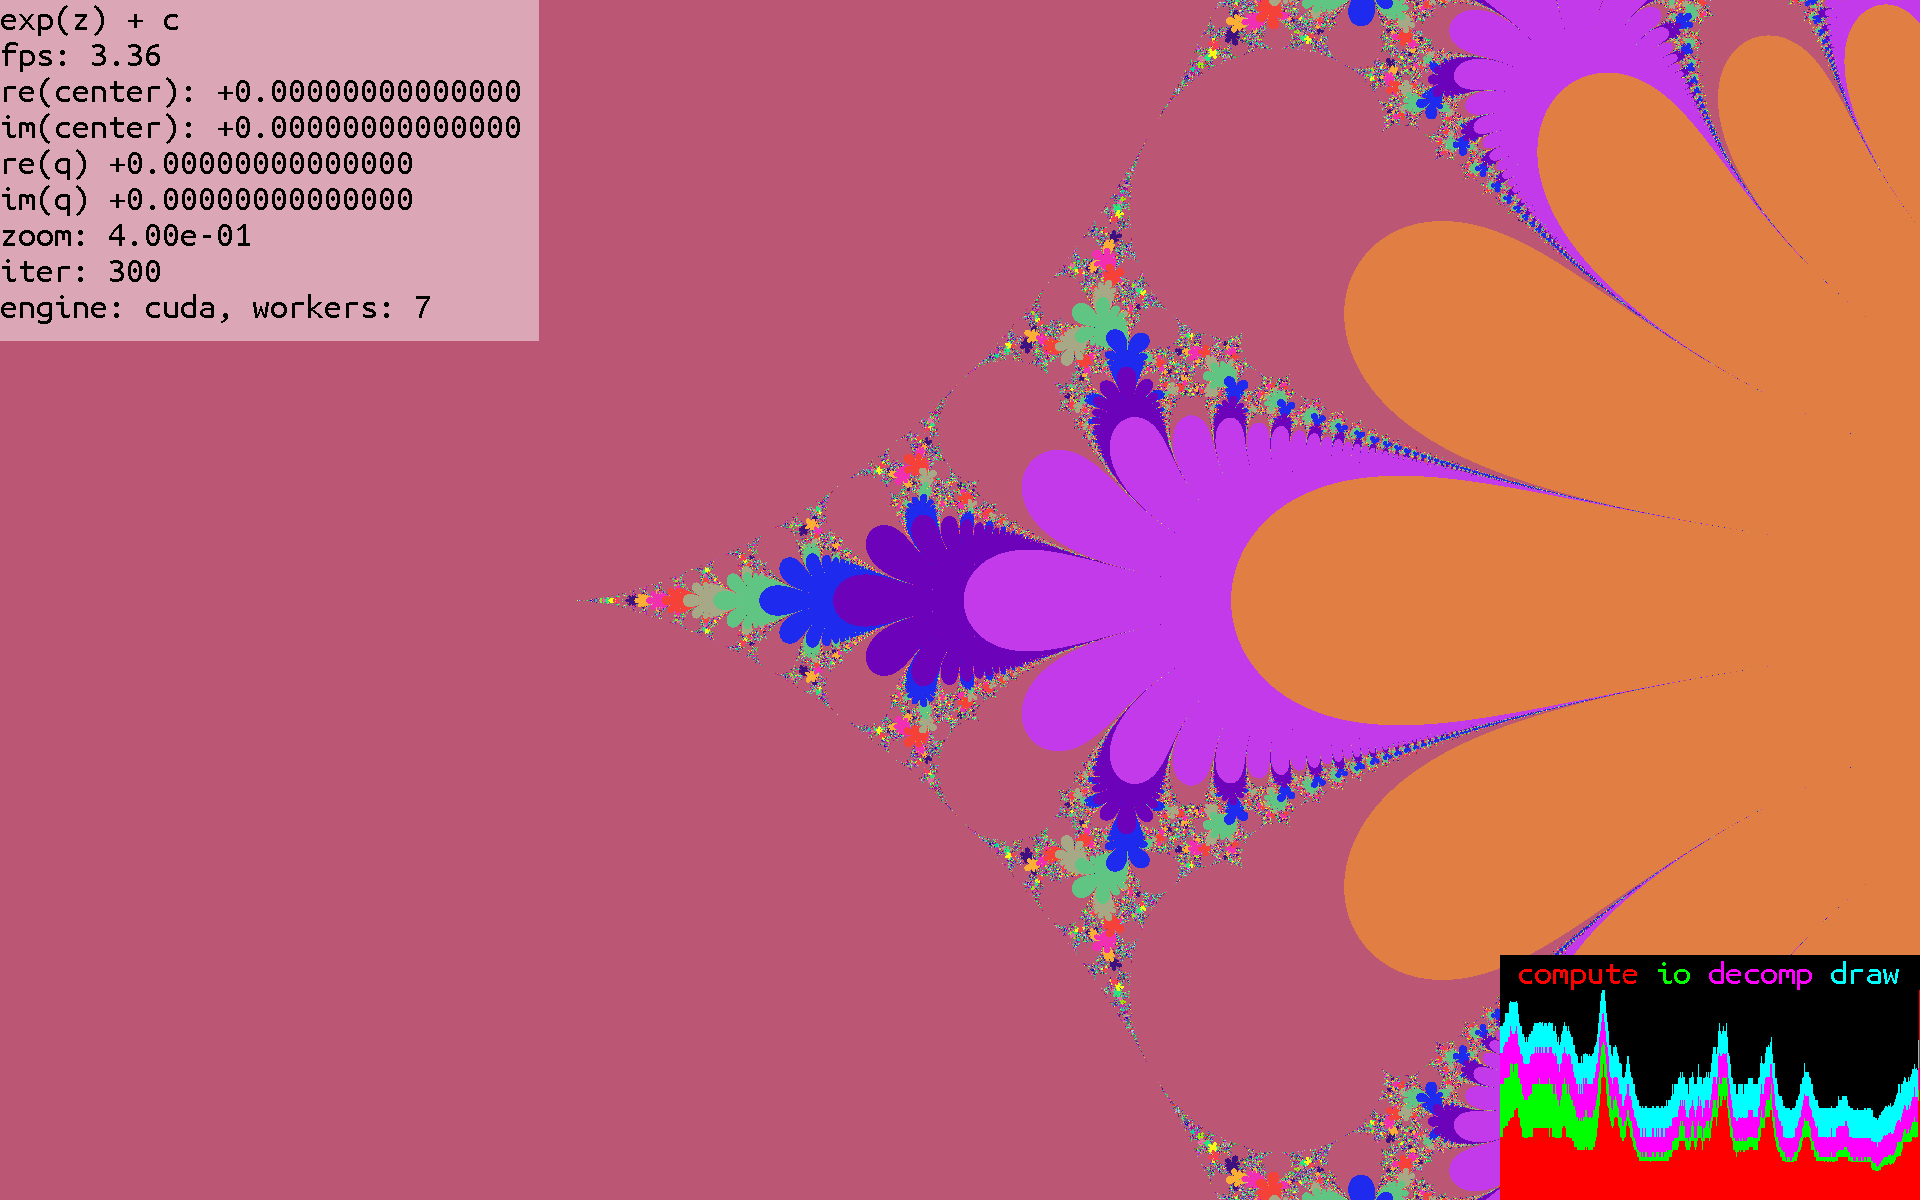
exp
Now, instead of using powers, we use the exponential function for iterations, which leads to an equation
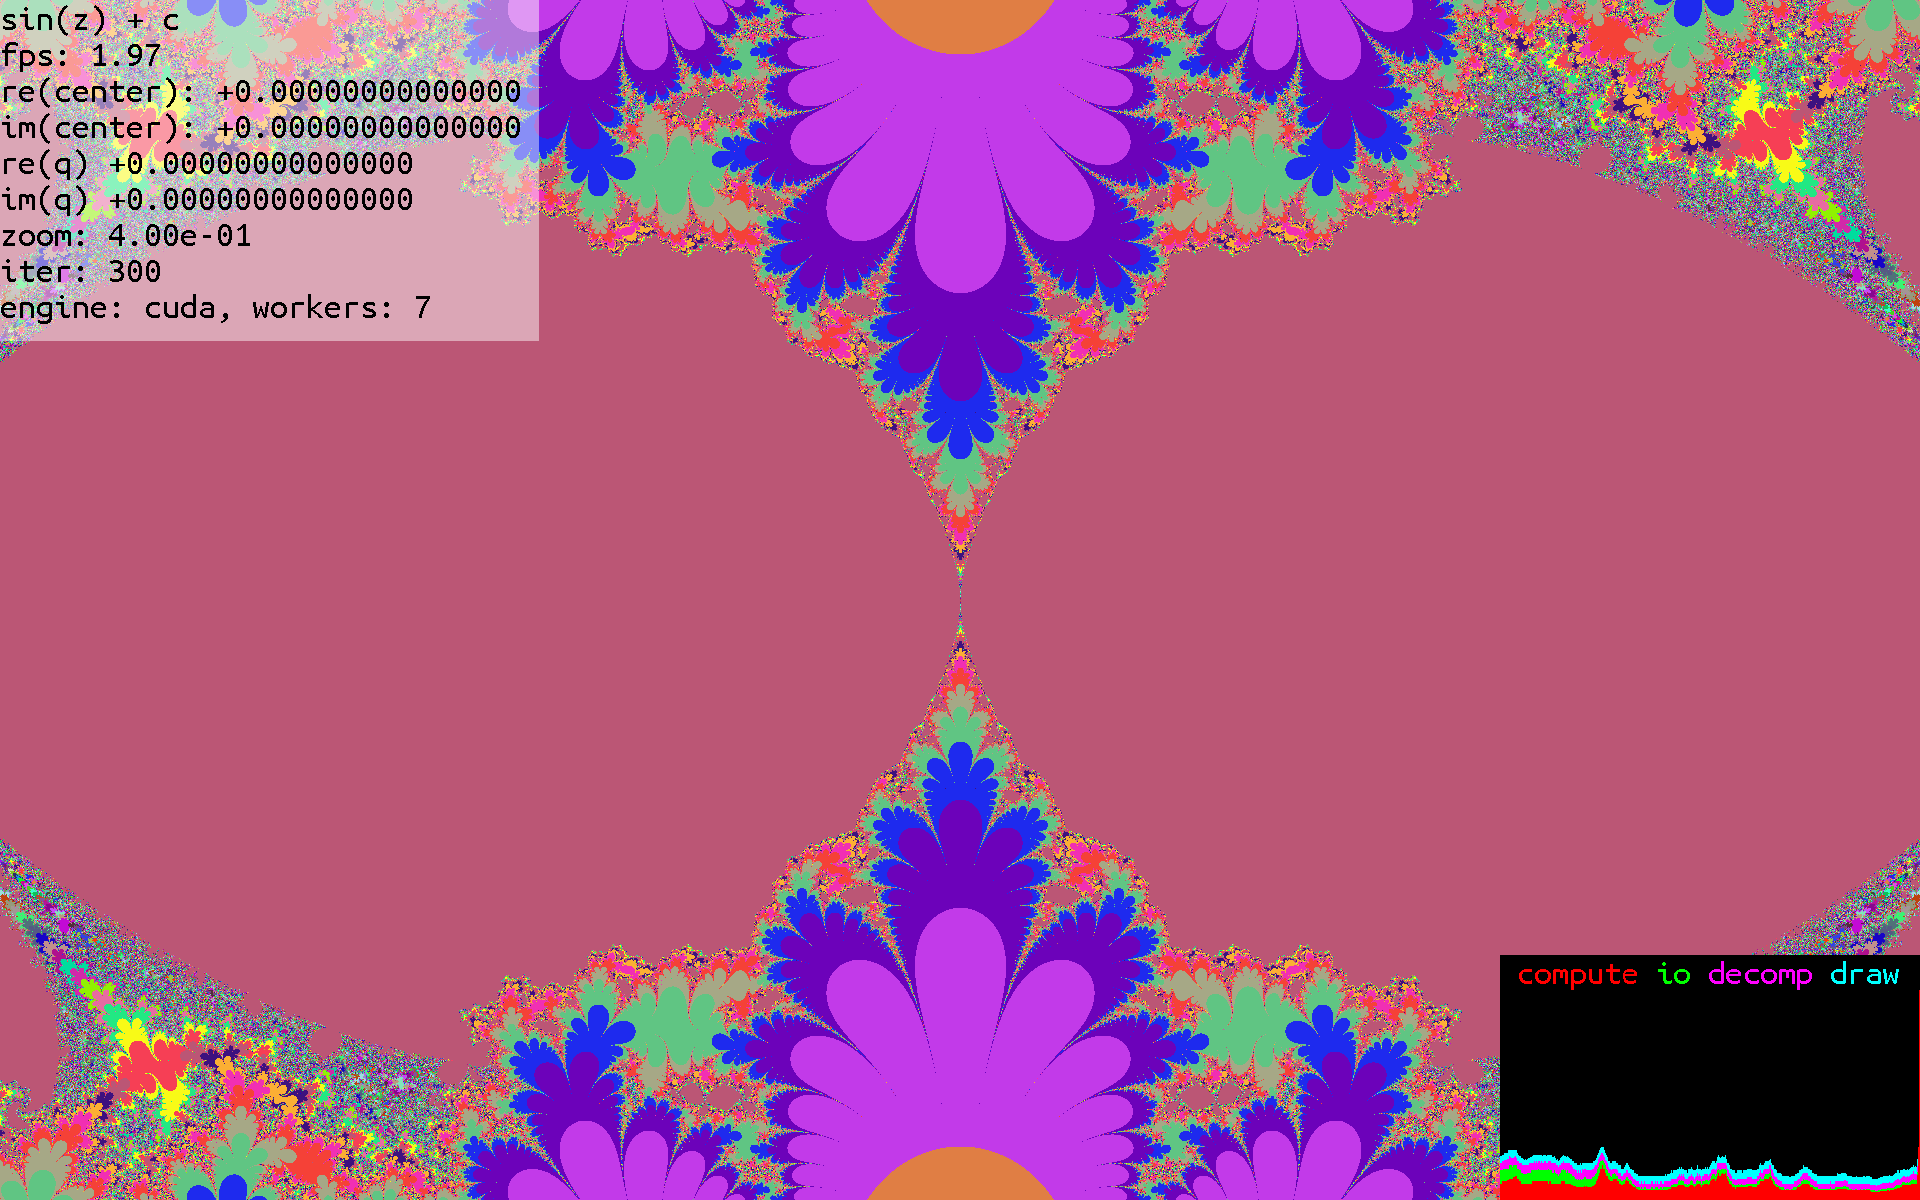
sin
We replace with to arrive at an equation
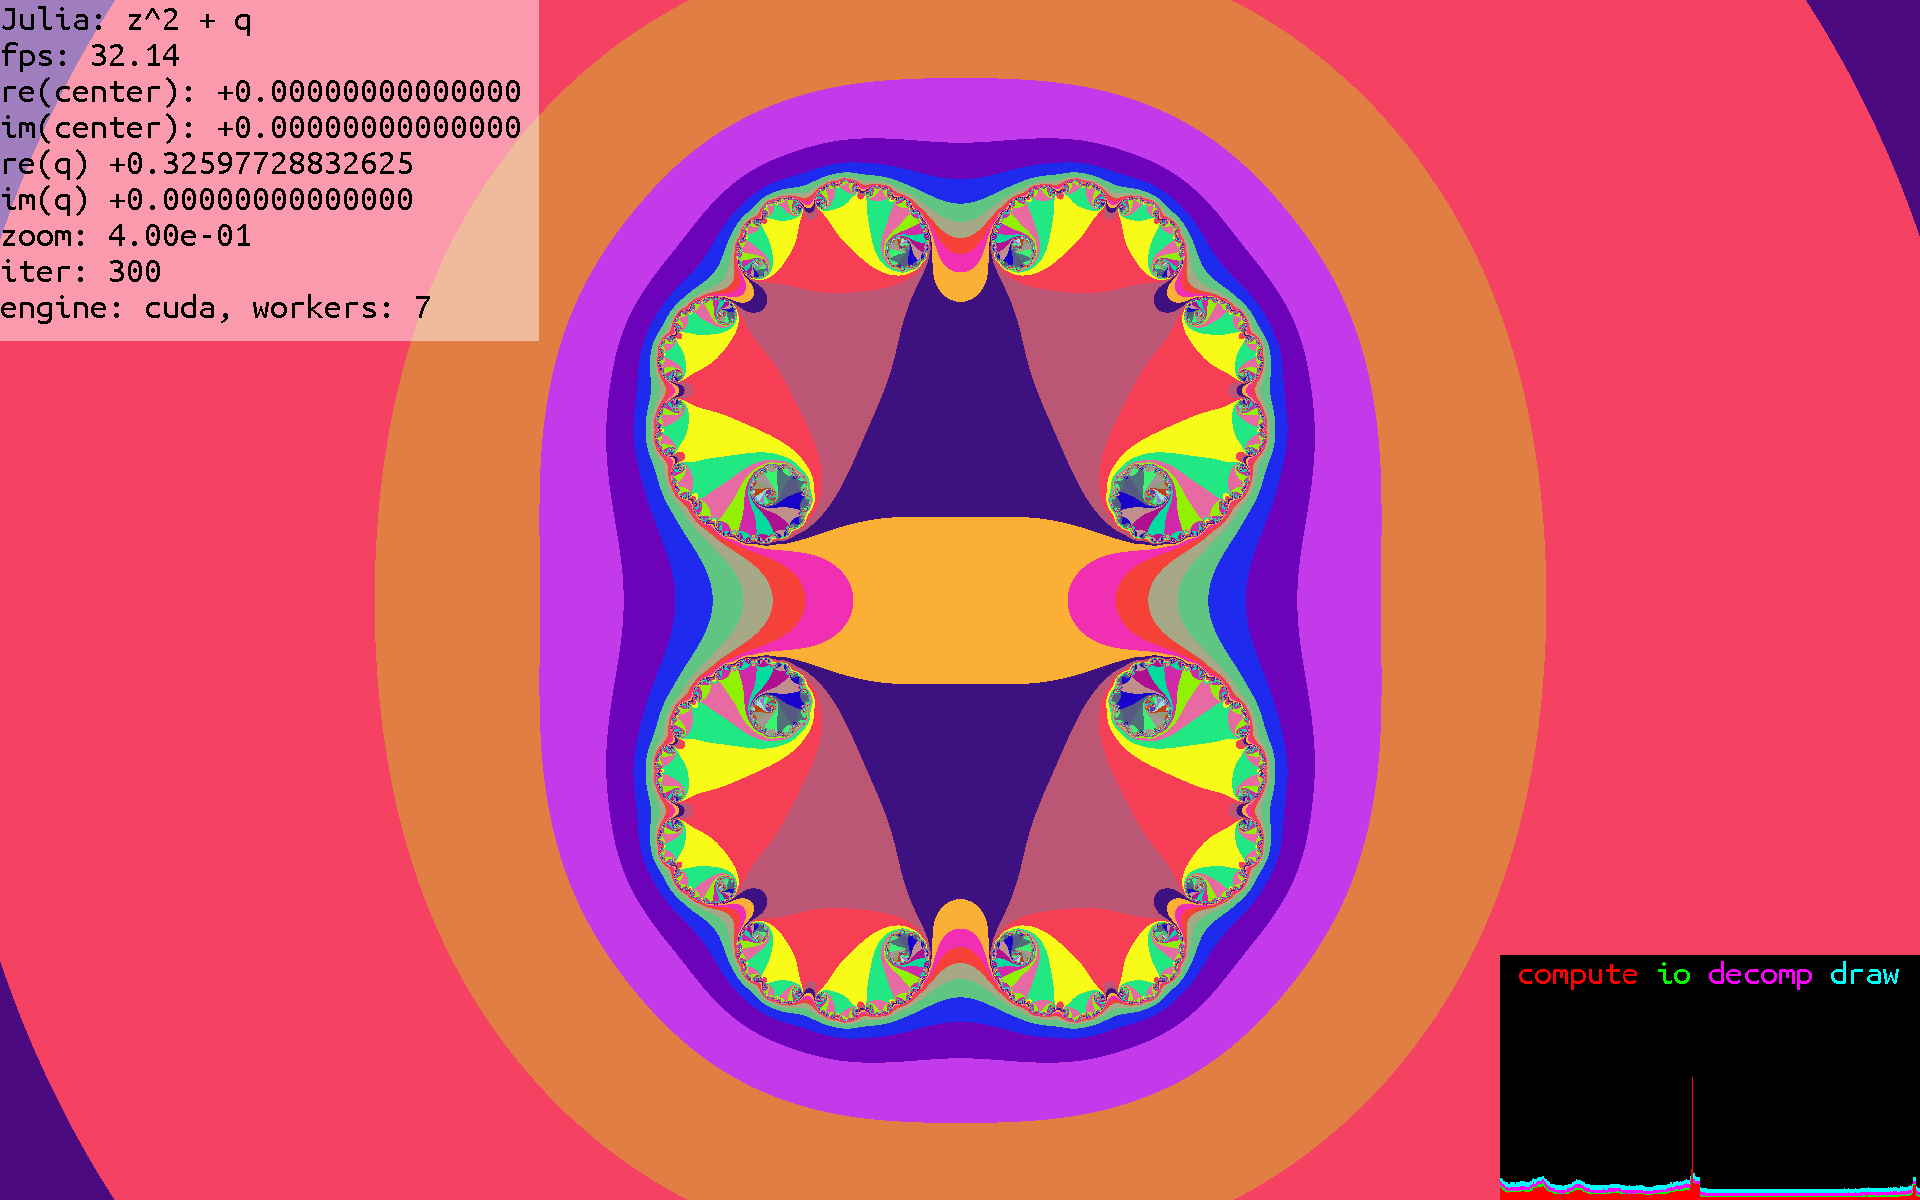
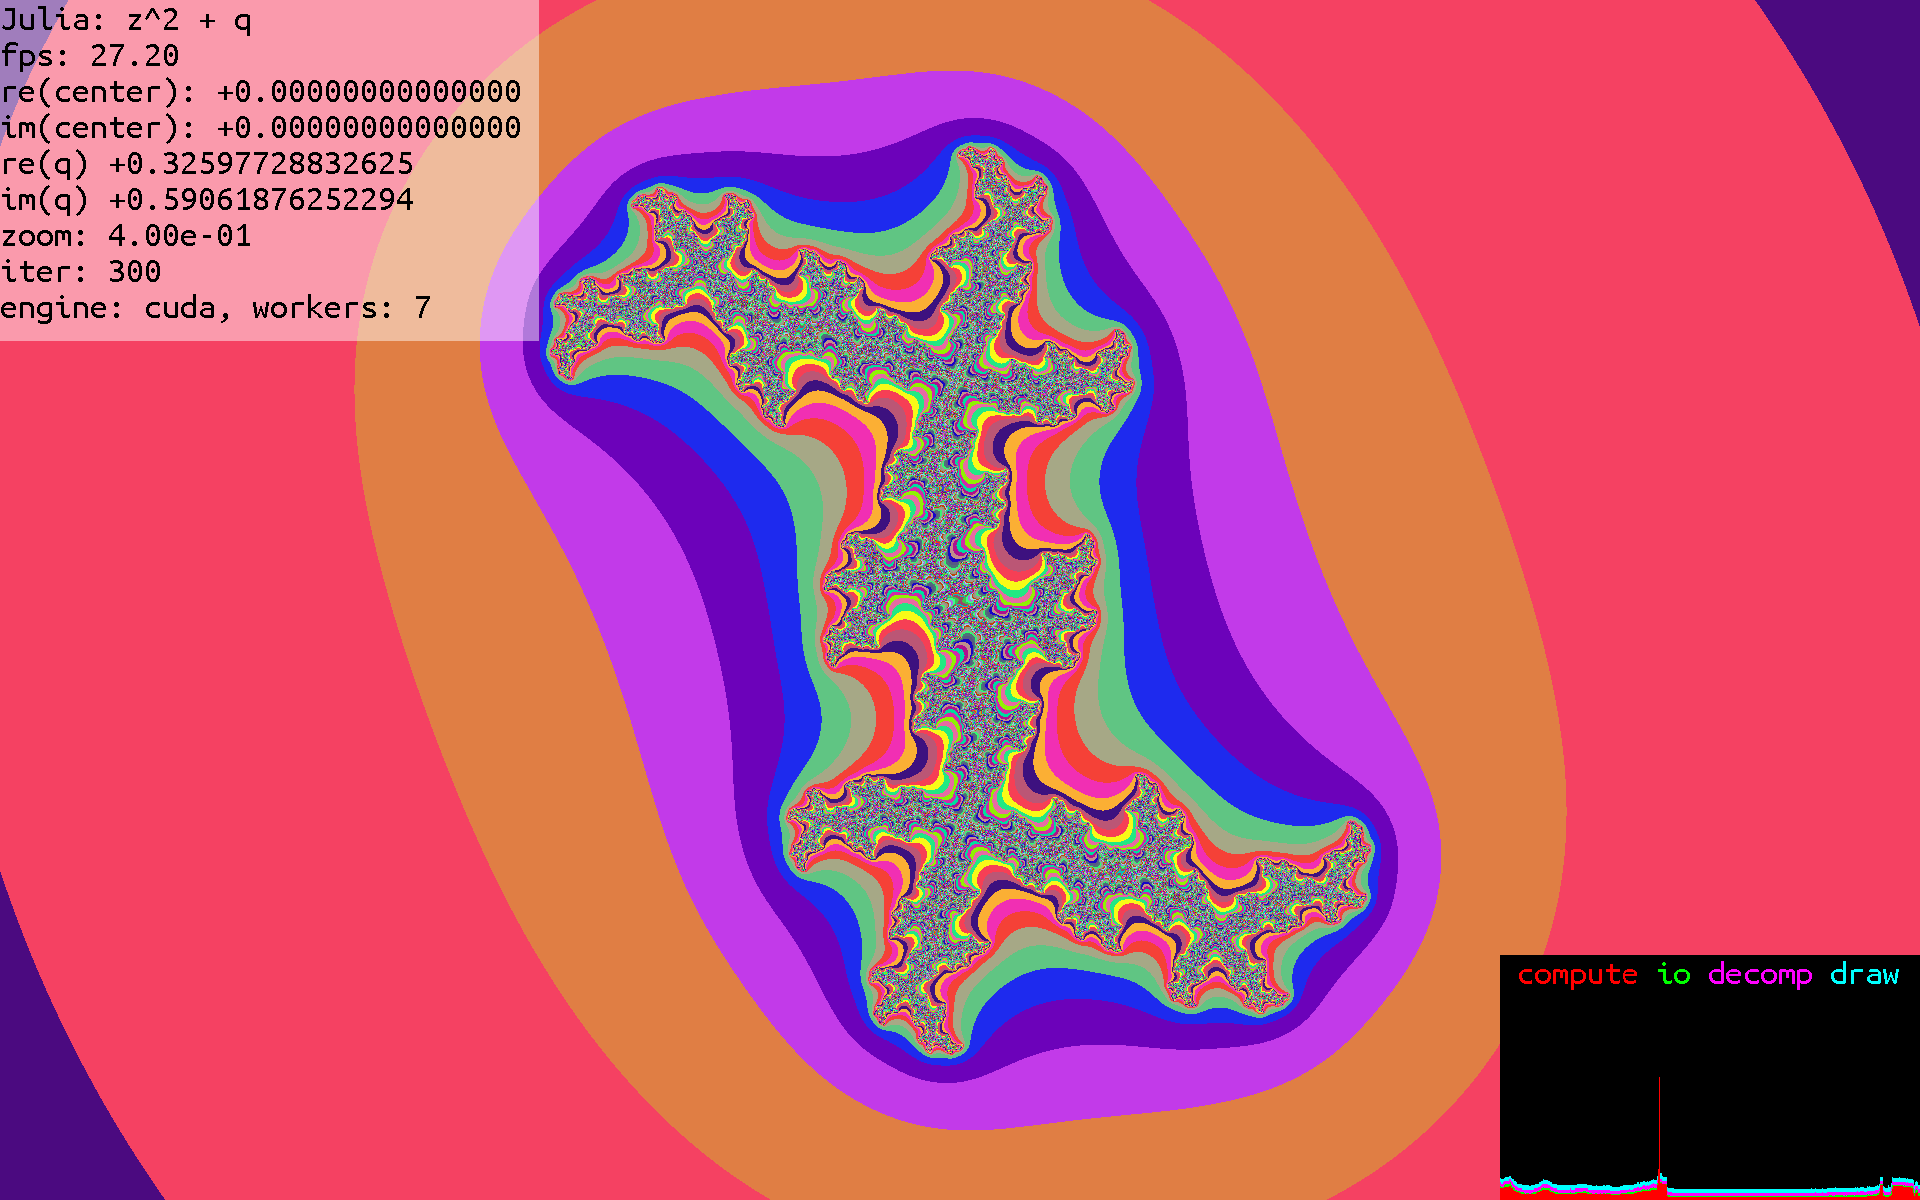
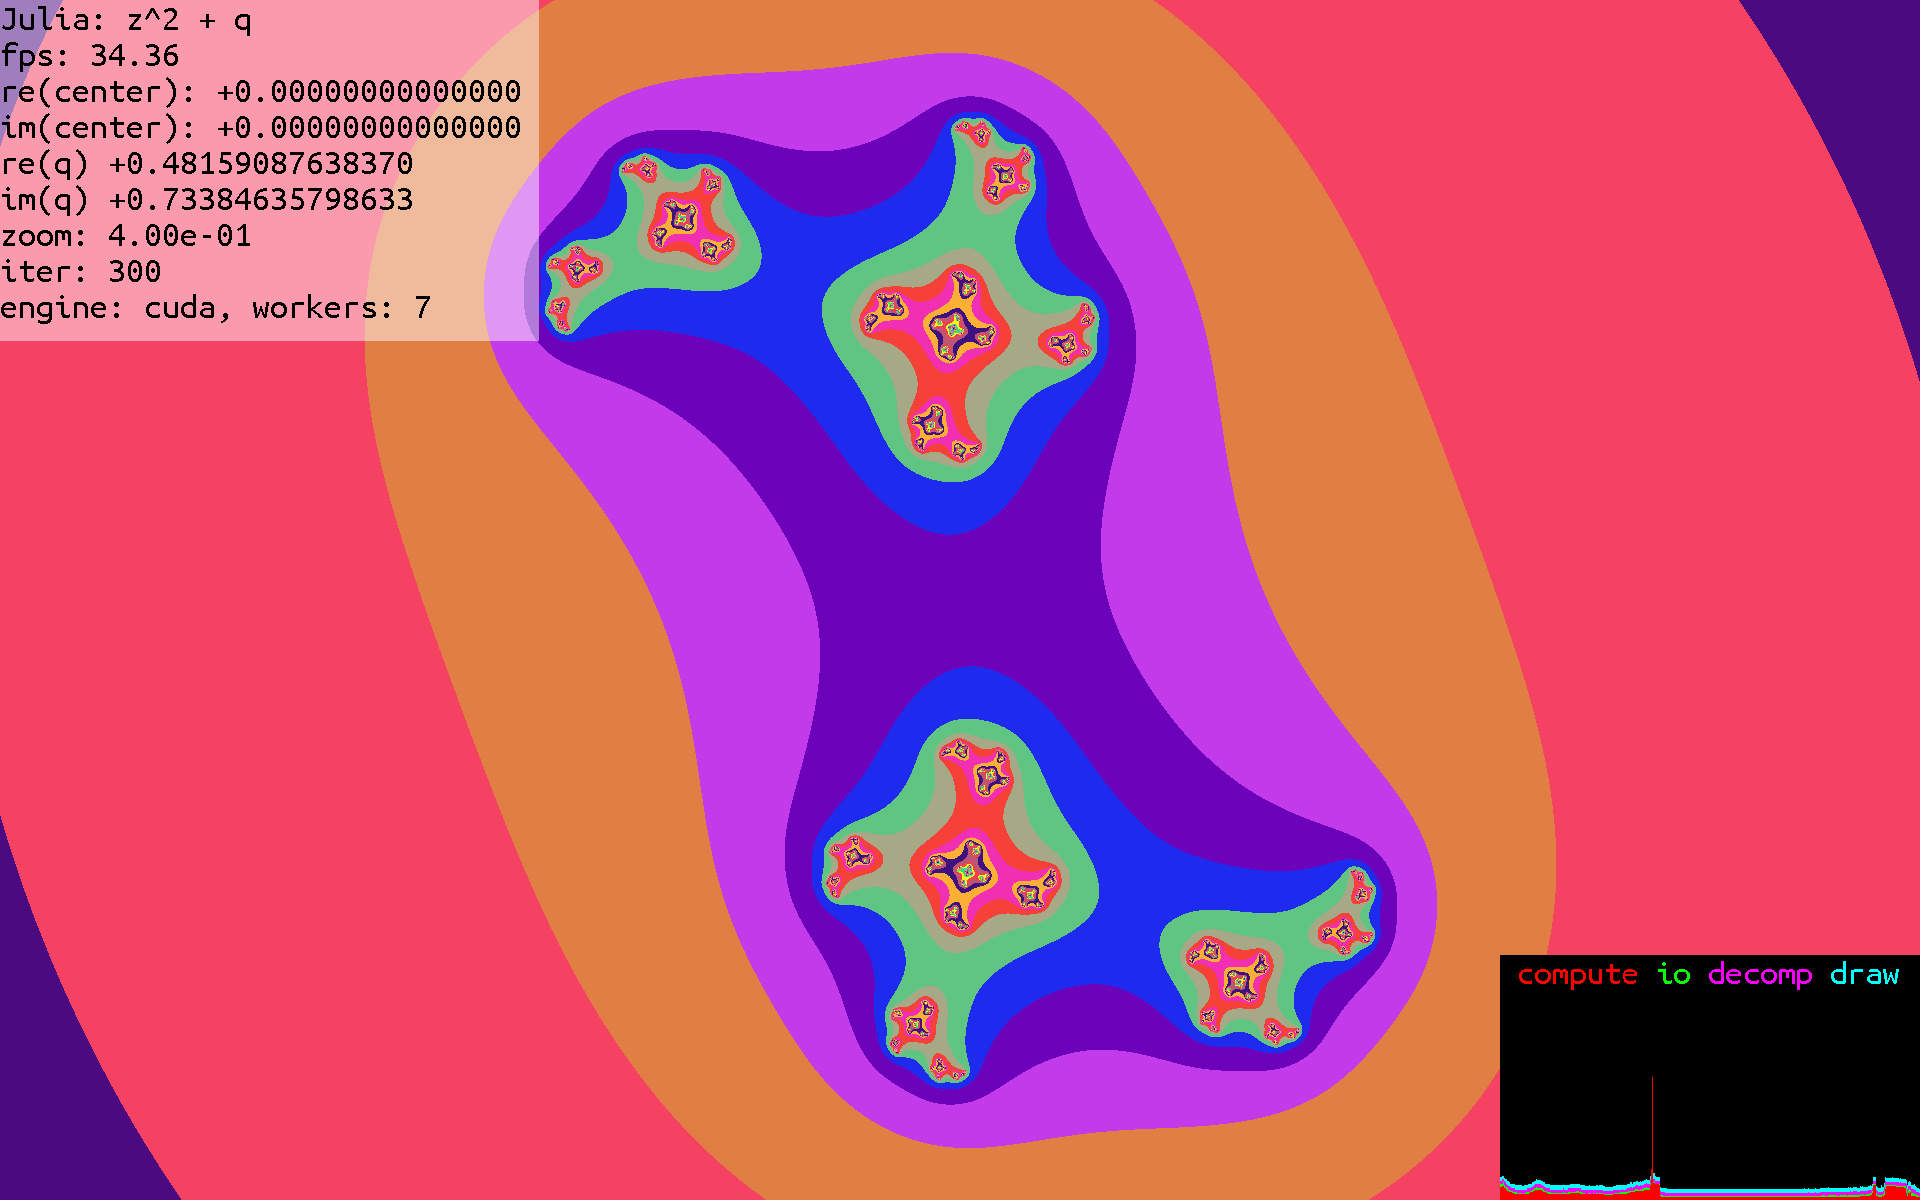
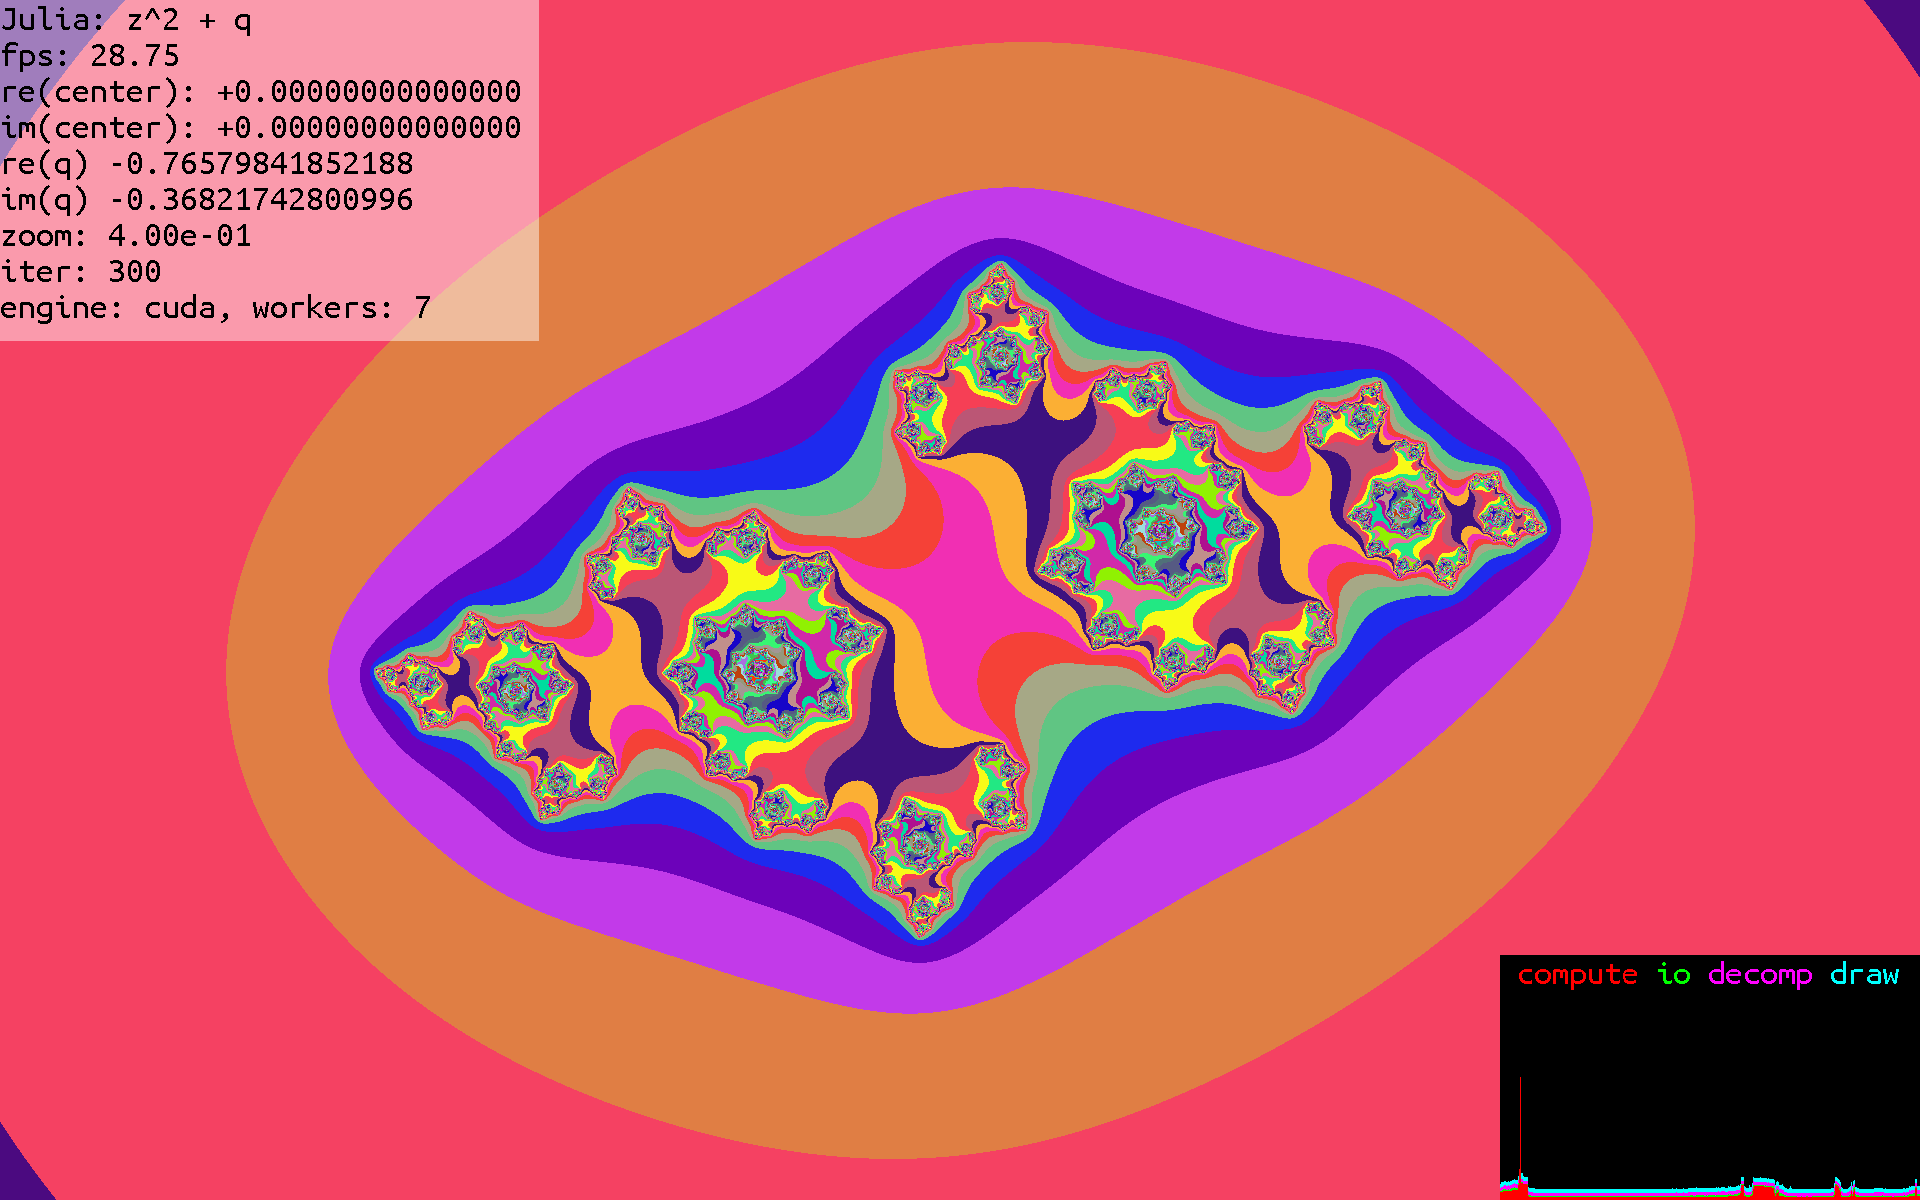
Julia
These sets are related to the mandelbrot set, but differ as so:
The Mandelbrot set starts with a point , and then iterates .
The Julia set also starts with , but iterates the function , where is user controlled.
Here are some Julia sets with various values of :
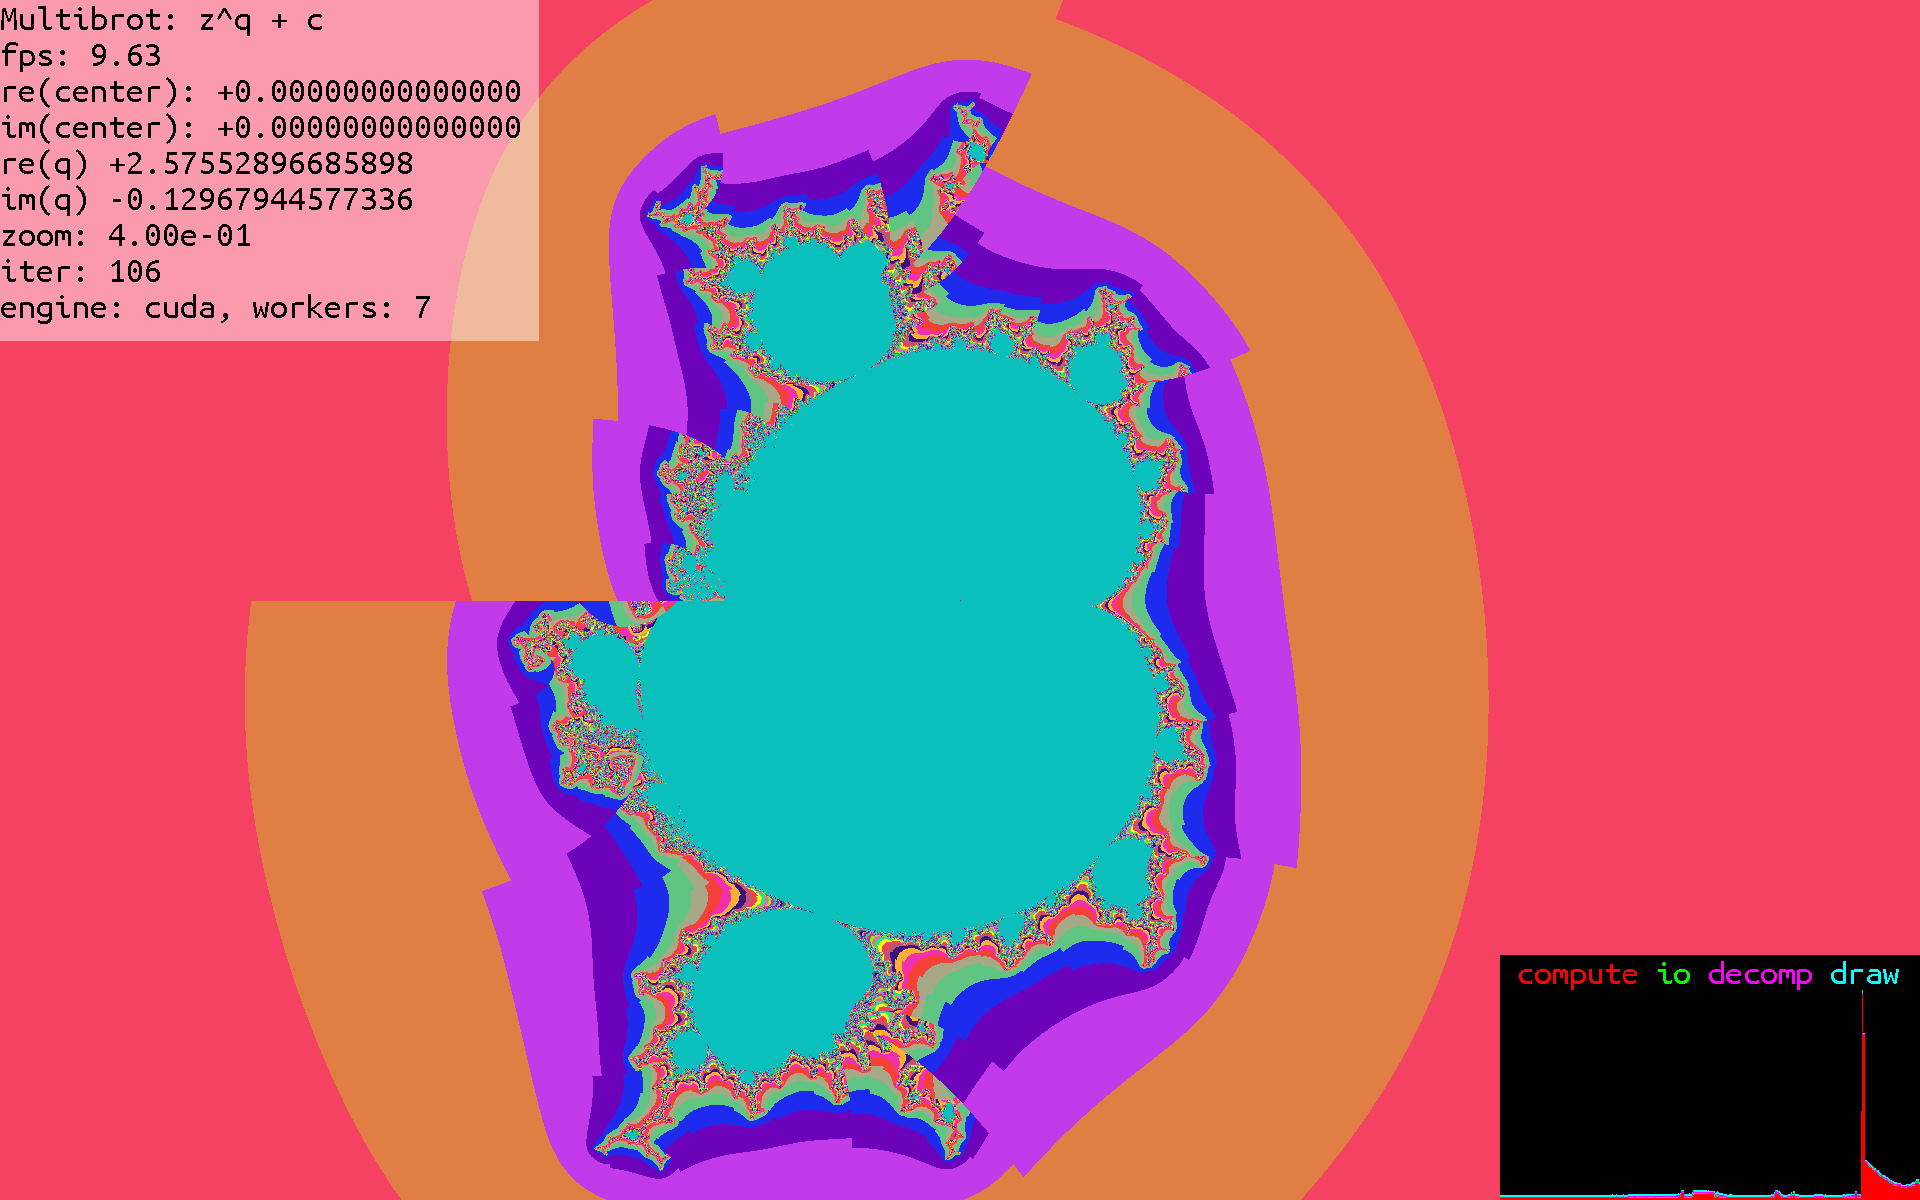
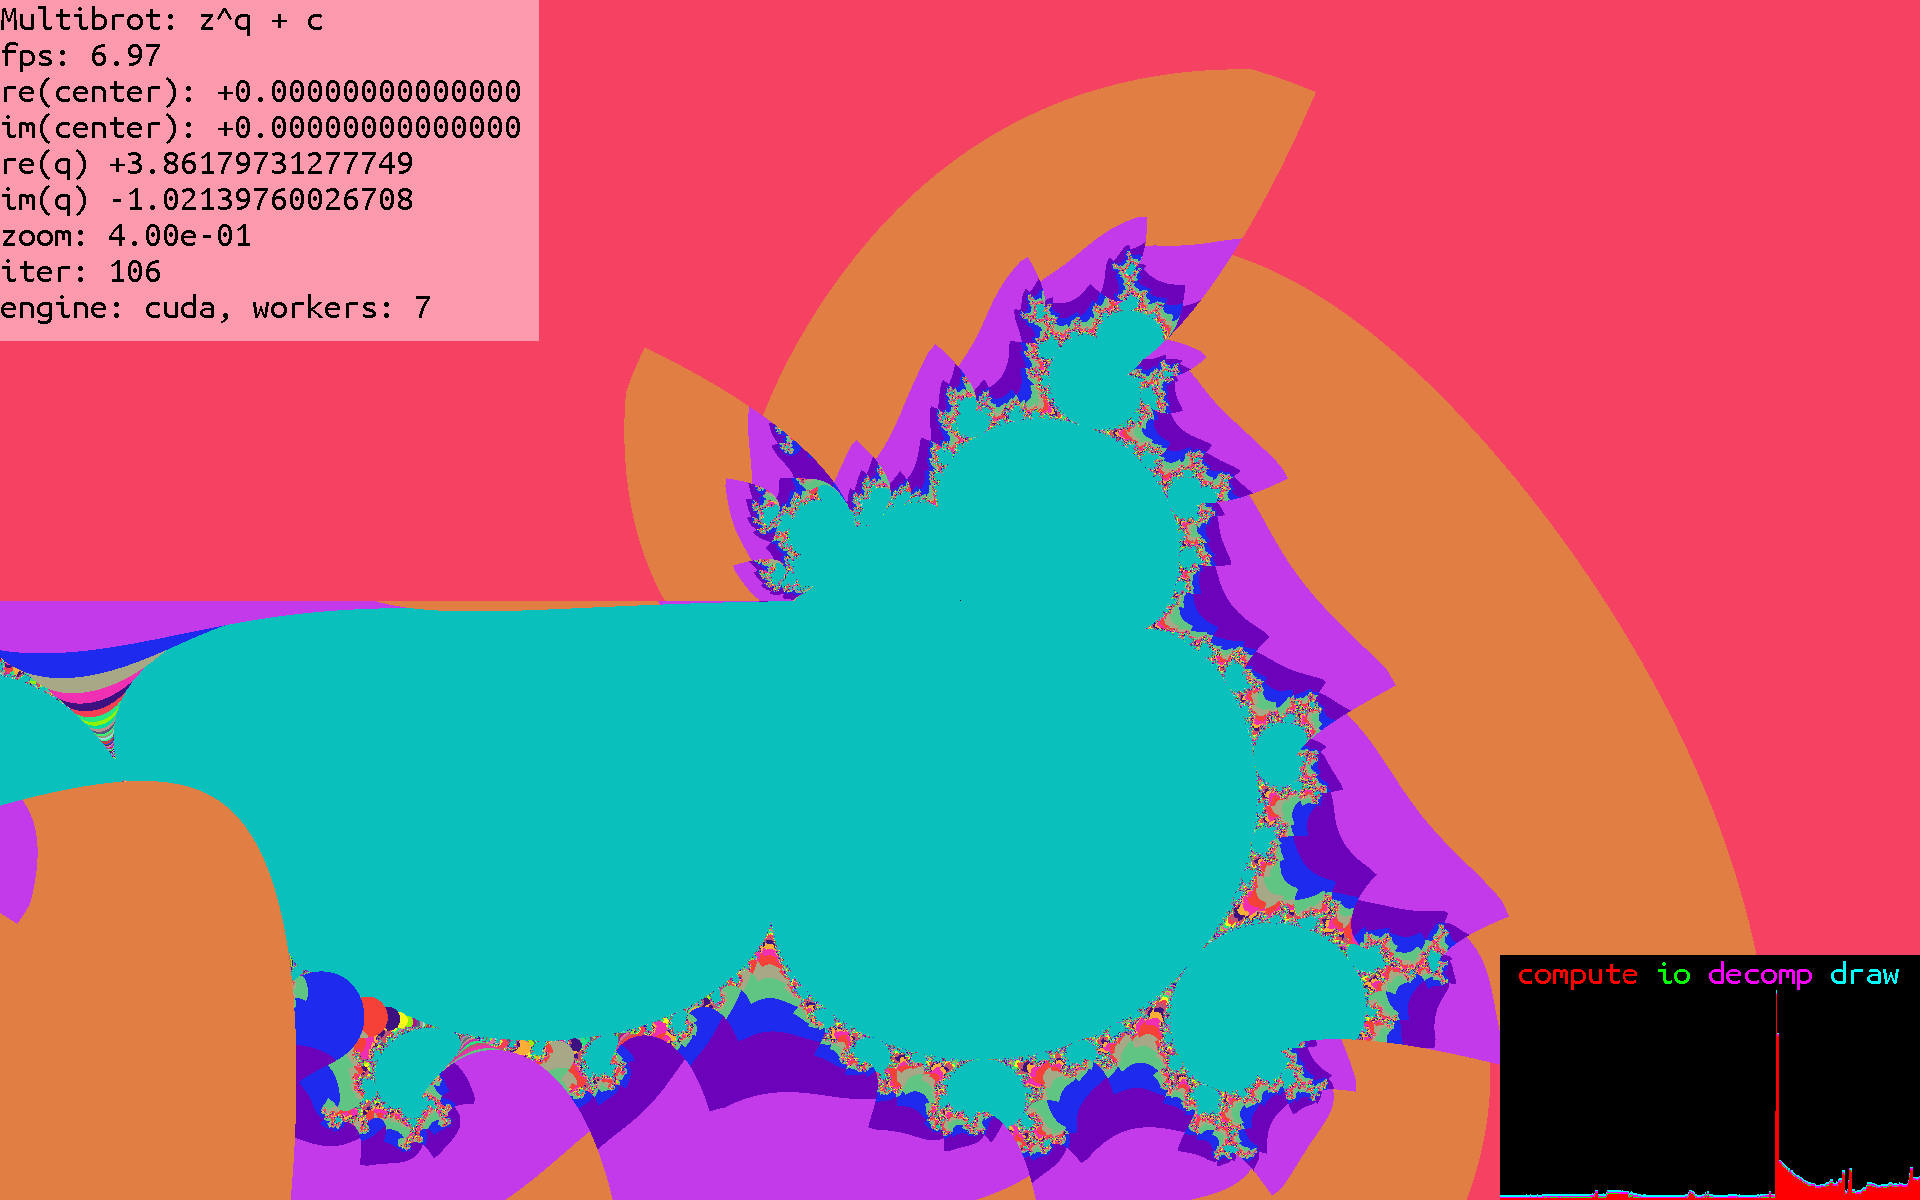
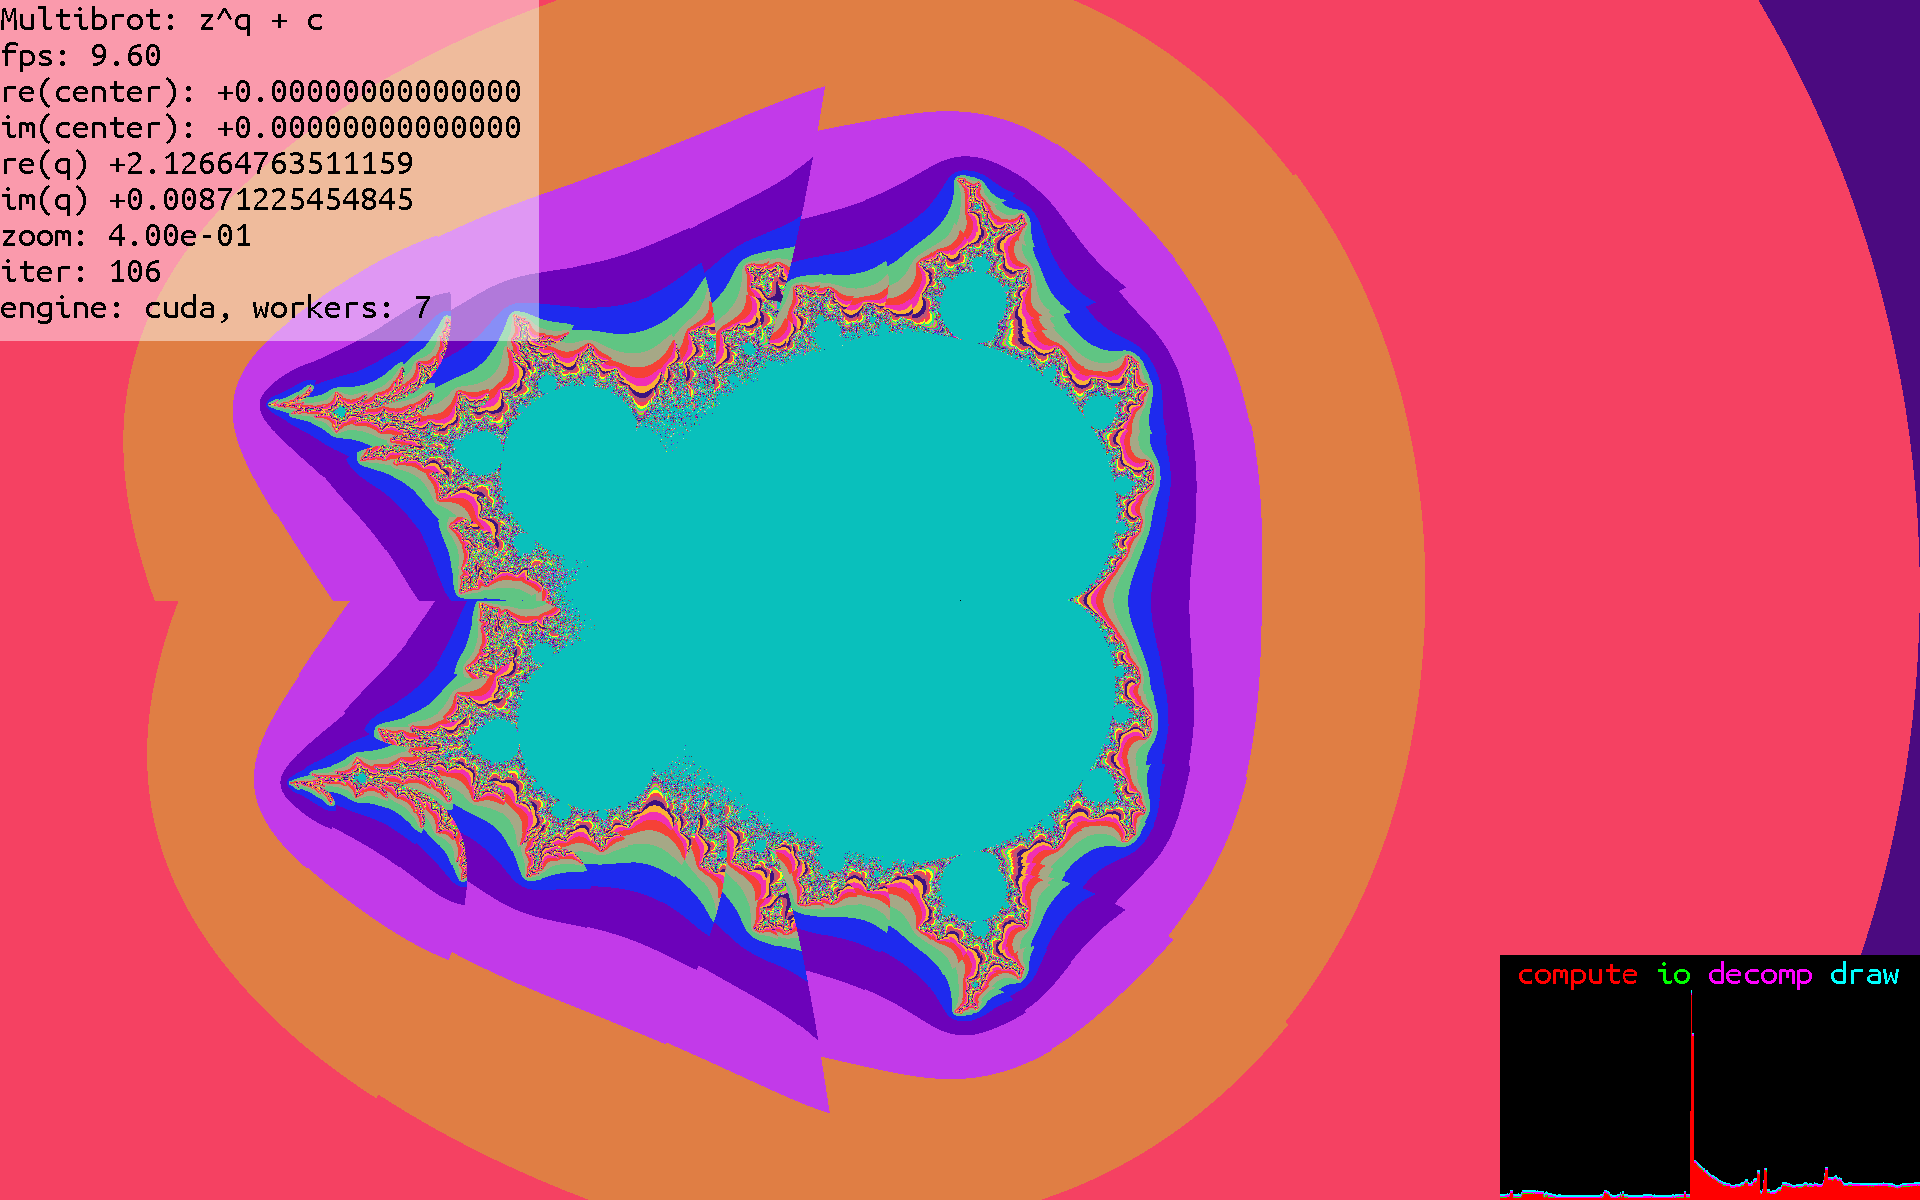
Multibrot
Another variation of the Mandelbrot set using a user input parameter, , is the Multibrot, which is a generalization of the Mandelbrot set.
The Mandelbrot set starts with a point , and then iterates .
The Multibrot set also starts with , but iterates the function , where is user controlled.
Here are some Multibrot images, with various values of :
###